 |
IGCSE Economics Resources
|
IGCSE Economics Resources
2027/2028/2029 -Paper -1-IGCSE Economics Topic Questions -Basic-Economic-Problem-Topic-Questions-Free Preview / 1.4 Production possibility curve (PPC) diagrams Topic Questions
- 1.4-Production-possibility-curve-PPC-diagrams-set-1-ms.pdf
- 1.4-Production-possibility-curve-PPC-diagrams-set-1-qp.pdf
- 1.4-Production-possibility-curve-PPC-diagrams-set-2-ms.pdf
- 1.4-Production-possibility-curve-PPC-diagrams-set-2-qp.pdf
- 1.4-Production-possibility-curve-PPC-diagrams-set-3-ms.pdf
- 1.4-Production-possibility-curve-PPC-diagrams-set-3-qp.pdf
- 1.4-Production-possibility-curve-PPC-diagrams-set-4-ms.pdf
- 1.4-Production-possibility-curve-PPC-diagrams-set-4-qp.pdf
- 1.4-Production-possibility-curve-PPC-diagrams-set-5-ms.pdf
- 1.4-Production-possibility-curve-PPC-diagrams-set-5-qp.pdf
Note:
1.4 Production possibility curve (PPC) diagrams Topic Questions / IGCSE Economics/ 0455/0987
Test your Self
IGCSE Economics Past Exam Questions / MCQ / Paper 1
Topic: Production possibility curve (PPC) diagrams
Try the questions first. Click to reveal the correct answer and explanation.
Try the questions first. Click to reveal the correct answer and explanation.
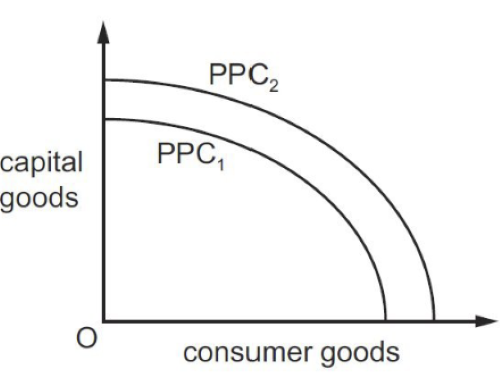
Q1. The diagram shows an initial production possibility curve of PPC1. What may cause the movement of the production possibility curve from PPC1 to PPC2?
Reveal Answer
Correct Answer: A – a better educated workforce
An outward shift of the PPC shows an increase in an economy’s productive capacity. A better educated workforce improves labour productivity and efficiency, so the economy can produce more capital goods and consumer goods. The other options would reduce productive capacity or not necessarily increase it.
An outward shift of the PPC shows an increase in an economy’s productive capacity. A better educated workforce improves labour productivity and efficiency, so the economy can produce more capital goods and consumer goods. The other options would reduce productive capacity or not necessarily increase it.
Q2. What economic concept must be at work when there is movement by a country along its production possibility curve?
Reveal Answer
Correct Answer: D – opportunity cost
Moving along a PPC means producing more of one good and less of another. This trade-off shows opportunity cost, because increasing one output requires sacrificing some of the other output.
Moving along a PPC means producing more of one good and less of another. This trade-off shows opportunity cost, because increasing one output requires sacrificing some of the other output.
Q3. Which statement about a production possibility curve is correct?
Reveal Answer
Correct Answer: B – A production possibility curve is an economic model of potential output
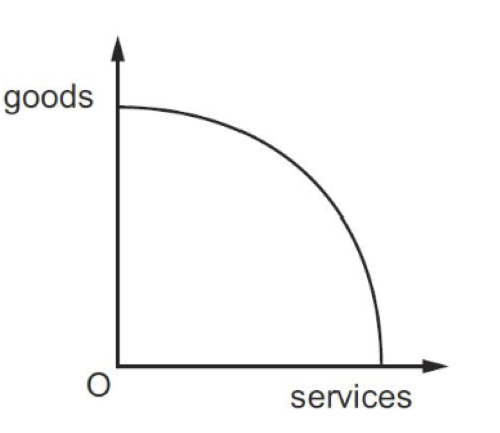
A PPC is a model showing the maximum possible combinations of two goods or services an economy can produce using available resources efficiently. It is not the same as a supply curve, it does not have to be straight, and it can apply to goods and services.
A PPC is a model showing the maximum possible combinations of two goods or services an economy can produce using available resources efficiently. It is not the same as a supply curve, it does not have to be straight, and it can apply to goods and services.
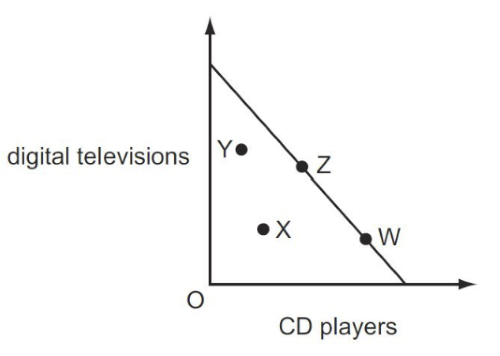
Q4. The diagram shows a production possibility curve for digital televisions and CD players. Which movement shows an increase in the use of existing resources to increase production for both digital televisions and CD players?
Reveal Answer
Correct Answer: B – X to Z
Point X is inside the PPC, showing inefficient use of resources. Moving to Z means the economy is using existing resources more fully and efficiently, increasing output of both goods. Movements along the curve usually involve gaining one good but sacrificing another.
Point X is inside the PPC, showing inefficient use of resources. Moving to Z means the economy is using existing resources more fully and efficiently, increasing output of both goods. Movements along the curve usually involve gaining one good but sacrificing another.
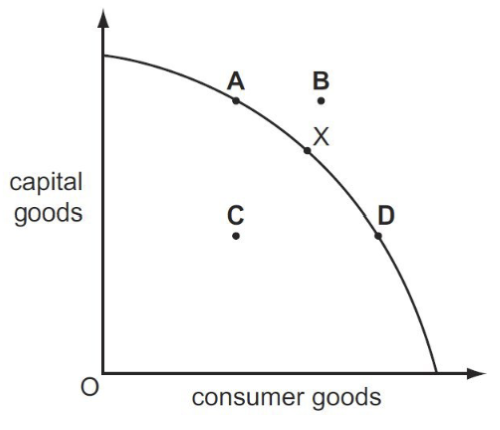
Q5. A country is producing at point X on its production possibility curve which shows how it can allocate its production between capital goods and consumer goods. A period of recession then causes some of its factories to close. Which point could represent the country’s new position?
Reveal Answer
Correct Answer: C – C
A recession causing factory closures means some resources are unemployed or underused. The economy moves from a point on the PPC to a point inside it. Point C is inside the curve, so it represents underutilised resources.
A recession causing factory closures means some resources are unemployed or underused. The economy moves from a point on the PPC to a point inside it. Point C is inside the curve, so it represents underutilised resources.
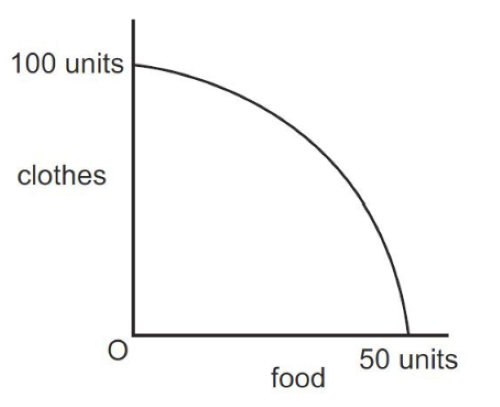
Q6. Using all available resources, an economy produces different combinations of two types of goods, clothes and food, shown by the production possibility curve (PPC) below. What does the PPC indicate?
Reveal Answer
Correct Answer: B – It is only possible to increase the output of clothes by reducing the output of food
A PPC shows trade-offs. If all resources are fully employed, producing more clothes means producing less food. This reflects scarcity and opportunity cost.
A PPC shows trade-offs. If all resources are fully employed, producing more clothes means producing less food. This reflects scarcity and opportunity cost.
Q7. How is an immediate effect of an increase in unemployment illustrated on a production possibility curve diagram?
Reveal Answer
Correct Answer: B – a movement of the production point further inside the curve
Higher unemployment means resources are not being fully used. The PPC itself does not immediately shift; instead, the economy moves to a point inside the curve, showing inefficient use of available resources.
Higher unemployment means resources are not being fully used. The PPC itself does not immediately shift; instead, the economy moves to a point inside the curve, showing inefficient use of available resources.
Q8. The diagram shows a production possibility curve (PPC). Why is the curve usually drawn like this?
Reveal Answer
Correct Answer: B – Opportunity cost changes
A PPC is usually curved because resources are not equally suited to producing all goods. As more resources are shifted from one use to another, the opportunity cost changes, usually increasing.
A PPC is usually curved because resources are not equally suited to producing all goods. As more resources are shifted from one use to another, the opportunity cost changes, usually increasing.
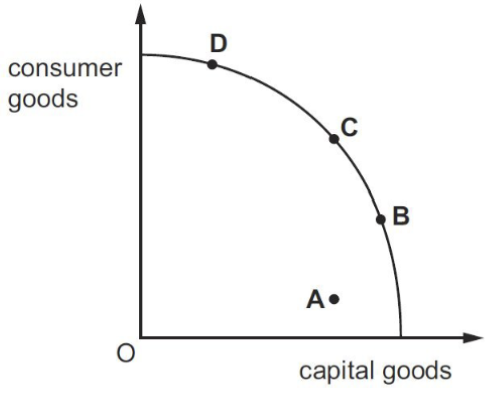
Q9. The diagram shows a production possibility curve (PPC) for an economy that produces both capital goods and consumer goods. At which point will the economy show the highest potential for sustained long run economic growth?
Reveal Answer
Correct Answer: B – B
Long run economic growth depends heavily on the production of capital goods, because these increase future productive capacity. Point B is the point on the PPC that gives the highest output of capital goods while still being efficiently attainable, so it offers the greatest potential for sustained growth.
Long run economic growth depends heavily on the production of capital goods, because these increase future productive capacity. Point B is the point on the PPC that gives the highest output of capital goods while still being efficiently attainable, so it offers the greatest potential for sustained growth.
Q10. What would cause an outward shift of a country’s production possibility curve (PPC)?
Reveal Answer
Correct Answer: C – an increase in the labour force
An outward shift in the PPC happens when an economy’s productive capacity increases. A larger labour force means more workers are available, so the economy can produce more of both goods. A fall in unemployment moves production closer to the existing PPC, not the curve itself.
An outward shift in the PPC happens when an economy’s productive capacity increases. A larger labour force means more workers are available, so the economy can produce more of both goods. A fall in unemployment moves production closer to the existing PPC, not the curve itself.
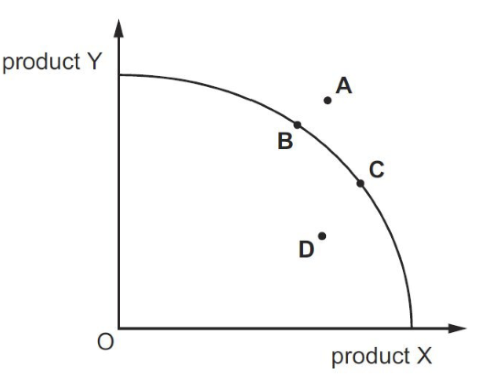
Q11. The diagram shows a production possibility curve (PPC). Which of these points shows the largest possible output of product Y currently achievable?
Reveal Answer
Correct Answer: B – B
The largest currently achievable output of product Y must be at a point that is both feasible and gives a high Y-value. Point A is outside the PPC and is not currently achievable. Point B is on the curve and gives the highest achievable output of product Y among the options.
The largest currently achievable output of product Y must be at a point that is both feasible and gives a high Y-value. Point A is outside the PPC and is not currently achievable. Point B is on the curve and gives the highest achievable output of product Y among the options.
Members Area
Unlock the complete range of solved past exam papers along with mock exams, notes, timed quizzes, interactive flipbooks and more.
Unlock Complete Resources
Course content
Notice
You have completed % Of the course
You can download the course completion certificate after completing the course
Well done
Congratulations!!!
You are now eligible to download the course completion certificate.